How to create and use paginated reports in Power BI
Table of contents
Power BI is Microsoft’s premier business analytics and artificial intelligence platform, which provides businesses and organizations access to interactive visualizations and business intelligence abilities.
One of the core parts that enable those capabilities are reports.
According to Microsoft, a Power BI report is essentially “a multi-perspective view into a dataset, with visuals that represent different findings and insights from that dataset”. They can either have a single visual or pages full of visuals.
What are Paginated reports in Power BI?
Paginated reports are a bit different. Paginated reports are designed to be printed or shared and people call them paginated or even pixel perfect because they’re formatted to fit perfectly on a page. Power BI Report Builder is the standalone tool for authoring paginated reports for the Power BI service.
Paginated reports allow you to display all the data in a table, even if it spans multiple pages, and they usually consist of multiple pages where each page is laid out exactly.
As we already mentioned, paginated reports are the ideal solution when you need a highly formatted, pixel-perfect output optimized for printing or PDF generation.
Power BI Report Builder
You will need the Power BI Report Builder to create a paginated report.
Power BI Report Builder is a tool from Power BI that you need to install separately. It allows you to create paginated reports and publish them on the Power BI service and ecosystem.
Here’s a brief overview of the tool’s key features and capabilities:
- Modifying data
- Modifying reports
- Multiple source reporting
- Multiple layouts
- Interactive features
How to create paginated reports in Power BI?
It’s easy to create paginated reports in Power BI. All you have to do is follow these steps:
- Launch Power BI Report Builder.
- Report Builder will take you to the New Report or Dataset screen.
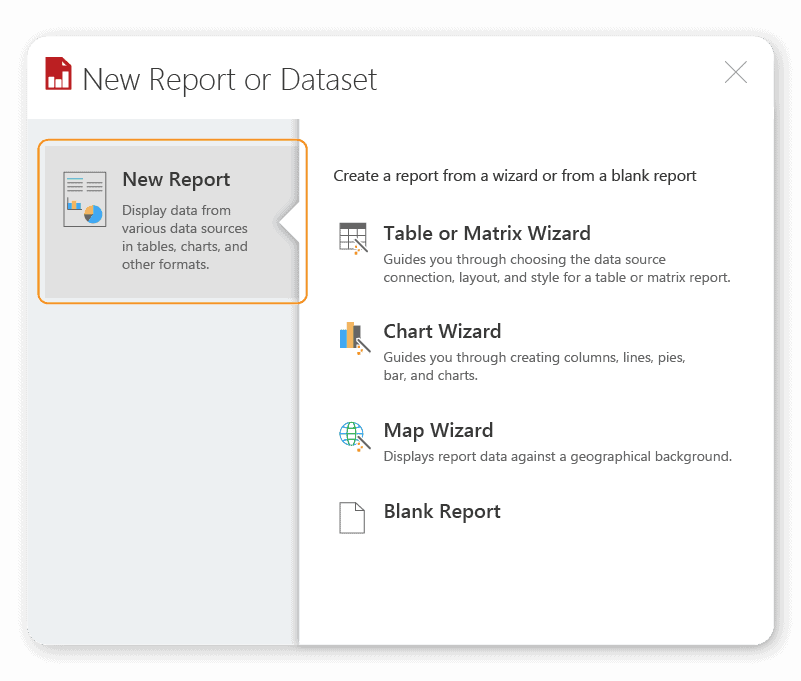
- Choose the wizard for the type of paginated report you want to create from the following: Table or matrix, Chart, Map, and Blank.
- Choose the dataset you wish to connect to.
- Once you’ve connected the dataset, choose the on-screen prompts and options according to the specific wizard you picked and create your paginated report.
- Once you’ve created a paginated report, you can export it to the following formats: Microsoft Excel, Microsoft Word, Microsoft PowerPoint, PDF, CSV, XML, and MHTML (Web archive).
Data sources for paginated reports
You can create Paginated reports from many different data sources, giving you flexibility and variability.
The Power BI Report builder can directly retrieve and read the data onto the reports from the server from the following sources:
- Azure SQL Database
- Azure Synapse Analytics
- Azure SQL Managed Instance
- Azure Analysis Services
- Power BI dataset
- Premium Power BI dataset (XMLA)
- Dataverse
- Enter Data
- SQL Server
- SQL Server Analysis Services
- Oracle
- Teradata
- ODBC
Why use a paginated report?
You must be thinking, why even go through all that in the first place? What’s in it for me?
For starters, paginated reports give you several advantages over ordinary Power BI reports.
There are two major drawbacks of Power BI reports:
- If they have multiple tables, Power BI reports require you to scroll through many pages to see the entire report.
- If you print a Power BI report, you will only get what is displayed at the time – instead of the full report.
On the other hand, when you print a paginated report using the Power BI Report builder, it will be printed completely with all the content in it. And paginated reports will automatically create however many pages are required to show all the data in them.
That is a faster and more automated process than ordinary Power BI reports that require you to manually create separate pages to include visualizations such as charts and graphs.
Unlike the Power BI paginated reports that are optimized for printing and PDF generation, Power BI reports are optimized for exploration and interactivity. A sales report where different salespeople want to slice the data in the same report for their specific region, industry, or customer and see how the numbers change would benefit the most from a Power BI report.
Also, paginated reports have one more additional advantage over Power BI reports. You can convert Power BI reports into Power BI paginated reports.
When to use Power BI paginated reports?
Let’s look at the situations where you will be using them.
According to Microsoft, these situations are where you need the following requirements:
- Reports ready for printing: The main unique selling point for paginated reports is that they are intended to be printed or used to generate PDFs. They are optimized automatically, considering aspects like data regions expanding and overflowing to many pages in a controlled and systematic manner.
- Ability to integrate multiple datasets: When you’re creating paginated reports, you are not limited by the number of datasets you can use. You can make paginated reports by combining data from multiple and various sources or even from static datasets.
- Ability to render in many formats: If you require rendering your reports in various formats, then paginated reports work best since Power BI can render them in the following formats: Microsoft Excel, Microsoft Word, Microsoft PowerPoint, PDF, CSV, XML, and MHTML. Then, the users of your report can export them to formats they see fit.
- Precise layouts: As mentioned, paginated reports are also referred to as pixel perfect. This makes them the best option when you need highly formatted and immaculate layouts to exact parameters such as the exact size and location configured in fractions of inches or centimeters.
- Dynamic layouts and response: Paginated reports are also the best choice for highly responsive layouts. You can achieve this by setting many report properties to use VB.NET expressions.
- In-depth report interactivity: Paginated reports, apart from being visually appealing, also have several interactive features that provide a better end-user experience, such as toggling visibility, links, interactive sorting, and tooltips.
- Customized user-specific layouts: Paginated reports offer opportunities for highly customizable experiences. How customizable? They can handle and merge responsive report layouts depending on the user profile opening and interacting with the report. You can customize and design the report’s parameters to automatically change and self-adjust, depending on the user’s profile. You have multiple options, such as filtering data differently, hiding data regions or visualizations, applying different formats, or setting user-specific parameter defaults.
- Support for native queries: One useful feature of creating paginated reports in the Power BI Report Builder is that you do not have to develop or create a Power BI dataset first. You can write native queries or utilize stored procedures for any data source supported and recognized by the software.
- Ability to work with static datasets: You don’t necessarily have to use preexisting datasets for paginated reports. When you need a static dataset, you can define it and enter its data directly into your report definition. This feature comes in handy when you need to boost and support a demo or showcase a proof of concept.
- Incorporation of parameters: Paginated reports can incorporate and reflect “highly customized parameterization experiences”. The ability to define your parameter defaults allows you to design your report so its users can quickly set their appropriate target filters. It’s also possible to define parameter defaults. These parameters can be very versatile and don’t strictly need to filter report data but can also be used to support “what-if” scenarios, dynamic filtering, or styling.
- Outputting images stored in data form: Paginated reports have another clever feature in rendering images stored in binary form in the data sources. If your data source has this situation, then paginated reports will handle it easily.
- Ability to write and incorporate custom code: Paginated reports allow you to write and develop your custom code blocks of VB.NET functions. You can then use them in any report expression.
- Subreports incorporation: Paginated reports can be built on top of one another, and they can be subreports in another paginated report. What does this mean? Simply put, you can embed other paginated reports, provided they are from the same workspace, into your current paginated report.
- Ability to render HTML: Paginated reports are the creme da la creme of report offerings in the Power BI ecosystem. Accordingly, they can display richly formatted text when stored as HTML.
Power BI and all its affiliated platforms, such as the Report Builder, are constantly evolving and upgrading. With time, the number of scenarios for paginated reports usage will widen even more.
How to maintain Power BI security?
At the end of the day, paginated reports operate in the Power BI frame, so security will ultimately be paramount. Power BI is an immensely powerful framework, but it has shortcomings and security loopholes that can put your reports, regular or paginated, at risk in some situations.
Tools like Microsoft 365 Groups and Yammer can help you in mitigating those inherent cons to Power BI along with maintaining a secure M365 environment that allows you to fully optimize and leverage the benefits of a Power BI workspace no matter which model you go for.
Many IT admins use Syskit Point’s customized, easy-to-use provisioning templates for Teams, Yammer Communities, Microsoft 365 Groups, and SharePoint Sites, to help solve the challenges of Power BI security.
Try Syskit Point for free and ensure that no matter which model you go for, you stay in control of your Power BI ecosystem.