
Mastering Power BI: workspace permissions, Power BI roles, and more
Table of contents
This article explains how to manage Power BI workspace permissions effectively, covering all major roles including Admin, Member, Contributor, and Viewer, and how to grant access to your reports and dashboards step-by-step.
Power BI is Microsoft’s premier business analytics service designed to enable access to interactive visualizations and business intelligence capabilities.
What sets Power BI apart from the other myriad of services is the simplicity of the user interface for ordinary individuals to navigate around easily and use to make their reports and dashboards.
Among the other services and utilities that Power BI offers are data warehousing functions such as data preparation, data discovery, and interactive dashboards.
Power BI permissions
Power BI functions by granting permissions to its users that allow them to access the application. Within them, there are various Power BI permissions for workspace reports which manage points of entry and access to the workspace itself.
These Power BI permissions are not immediately visible or apparent as many users engage with a report via an application or through the workspace.
Before understanding how permissions are granted and how to access them, you should know what user categories and roles Power BI offers.
What are Power BI workspace roles and what can each role do?
You can add any user to a Power BI workspace by typing their name and assigning them from four predetermined roles that grant various privileges and permissions.
Power BI workspace roles allow you to manage who can do what in a given workspace so you can have effective collaboration.
If you want to learn more about the specific capabilities of each Power BI role and the detailed notes about it please visit Microsoft’s article dedicated to Power BI roles.
1. Power BI Viewer
Can only view content, no editing or sharing allowed.
As is self-explanatory by the title of this Power BI role, these kinds of users can view and interact with reports and dashboards without changing their contents. They have the lowest level of control over the data and the report.
2. Power BI Contributor
Can add and edit content but not share or manage roles.
Apart from being able to view and interact with reports and dashboards, this user type goes a step further by being able to create, edit, copy, and delete items in a Power BI workspace, publish reports, schedule refreshes, and modify gateways.
3. Power BI Member
Can edit content and share, but cannot manage workspace roles.
As with the contributor user type above, this user type can do all that the preceding user types can do. In addition, the member user type can also feature dashboards on the service, share items, allow others to reshare items, and publish or republish. This role can also add other users to the viewer or contributor role.
4. Power BI Admin
Full control including managing permissions and workspace settings.
This user type can carry out all functions of the previous user types as well as add and remove users, including other admins.
How to get complete visibility into Power BI workspaces
With Syskit Point, getting detailed visibility into Power BI workspaces is easy. You can quickly get a list of all detected workspaces in your Microsoft 365 environment in a central web interface and save hours of manual work.
You will get an overview of all dashboards, reports, dataflows, and datasets per each Power BI workspace so you can find the answers you need immediately. See it in action:
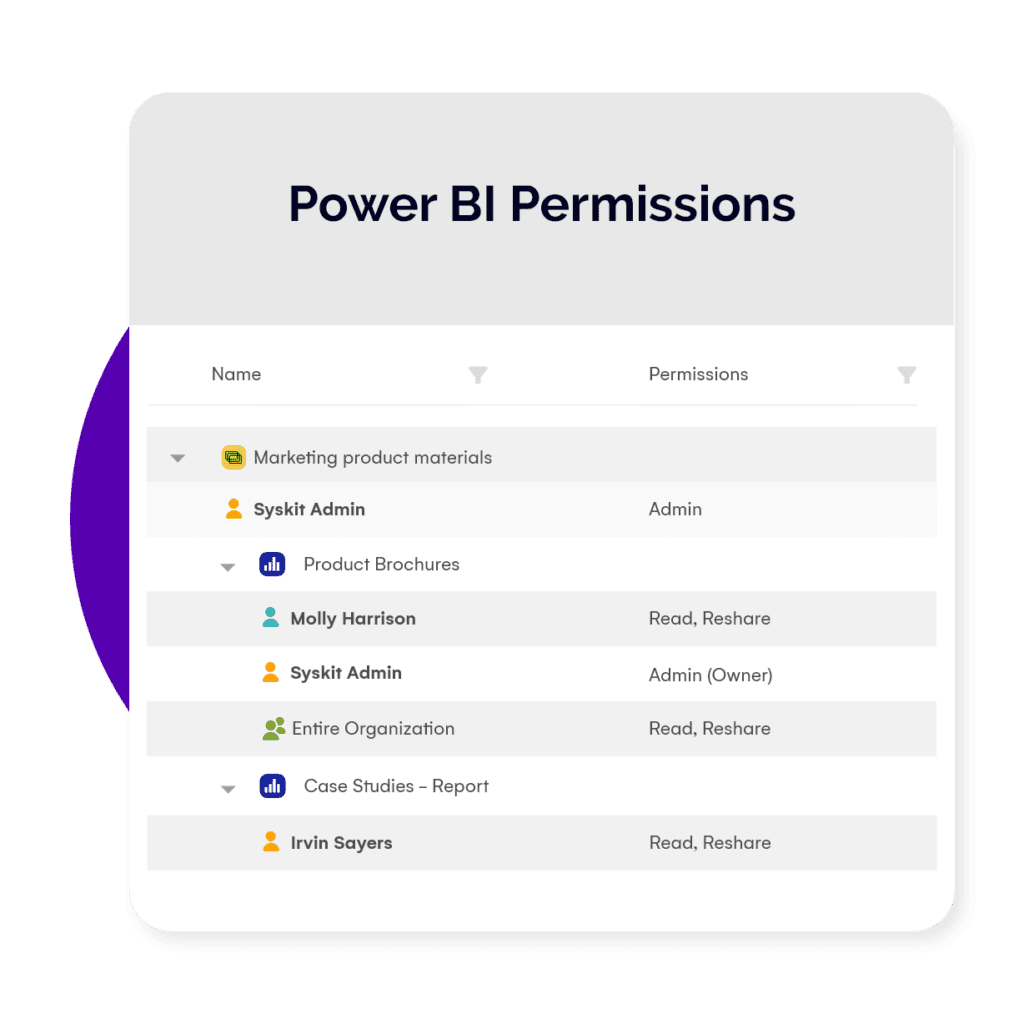
Power BI workspace permissions overview
The Power BI workspace permissions report in Syskit Point gives you a detailed overview of who has access to your Power BI workspaces. This includes directly given permissions as well as users that gained access via a sharing link.
Step-by-step guide: How to manage Power BI workspace permissions
Now that the different user types and what they can do, are out of the way, you must know how to manage Power BI permissions for a Power BI workspace.
There are several ways you can grant Power BI workspace permissions to users.
Route 1 – Direct Access From Manage Permissions
Step 1 - Share Report with Direct Access
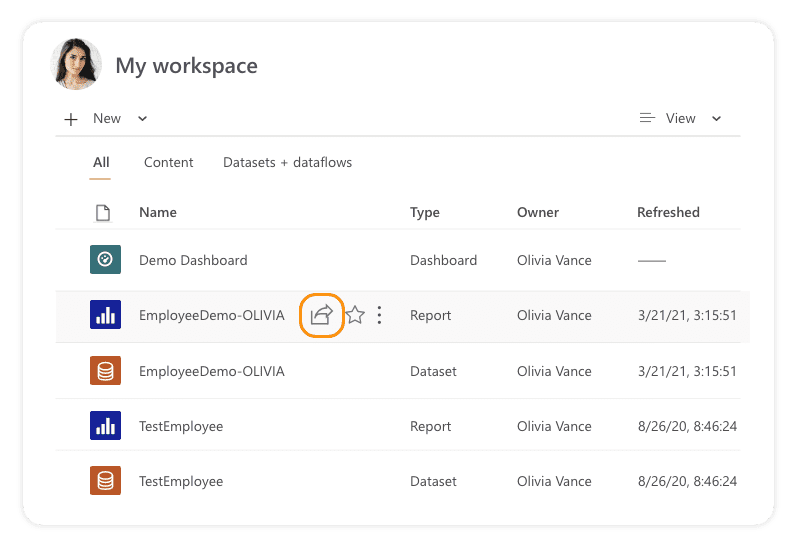
Go to the Power BI workspace containing reports or dashboards to which you want to give access to the user, and then click on the share option of the report/dashboard.
Step 2 – Manage Permissions
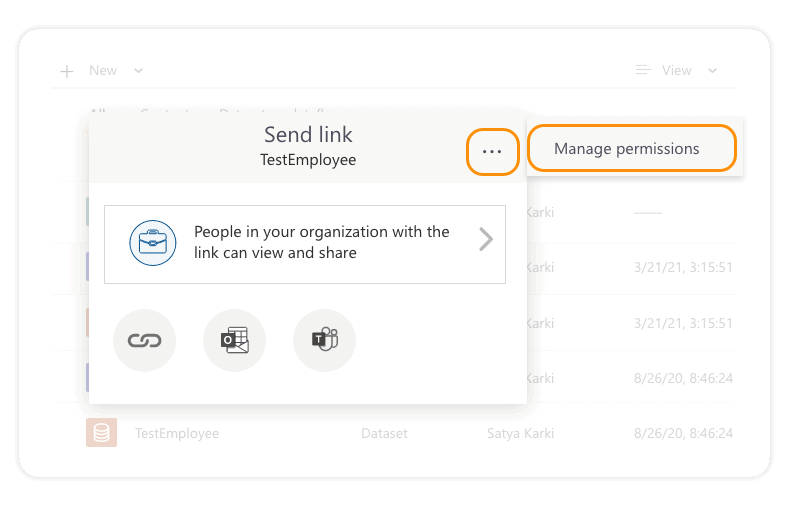
After clicking on the Share option, you will get the dialog below. Click on More options (…) on the upper right of the sharing dialog box and then click Manage permissions.
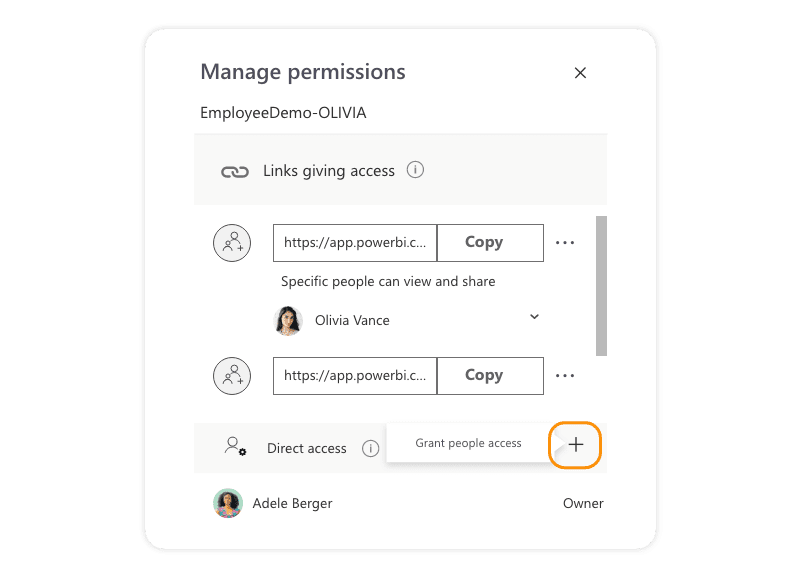
You will get the ‘Manage permissions’ pane, as shown below. You can see a list of people who have access to this report, and you can add a new user to have access. To add a new user, click on the + icon.
Step 3 – Provide user and Grant access
Provide the username or email address, and click on Grant Access. Here, you can add multiple users and share the report. You can select or unselect the sharing and build report option available in the dialog box as per your need.
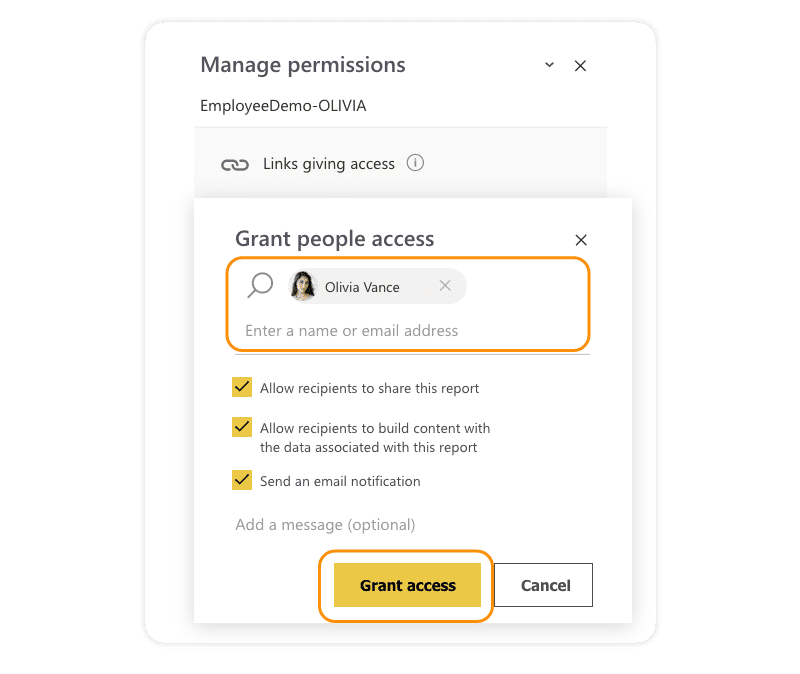
Power BI report permission options explained:
Allow recipients to share this report: Lets users reshare the report with others inside the organization.
If you select this option while giving permission, then the user will get the option to share this report or dashboard with another user.
Allow recipients to build content with this report’s data: Enables users to create new reports or dashboards using the underlying dataset.
This option allows the user to build a new report using the data/dataset of this report or dashboard which you are sharing. You can select or unselect these options per your user permission level or need.
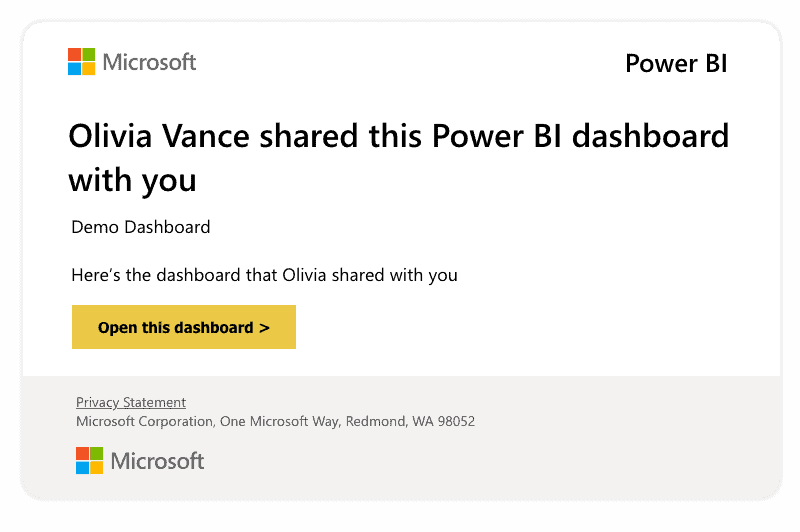
Send an email notification: Notifies users with an email and link for quick access
With this Send an email notification option selection, the user gets an email with a link to view the report or dashboard. The below image shows a sample email notification.
This way, you can give access to the report to the users.
Route 2 – Direct Access from Advanced Option
On the other hand, you can go to the Advanced option and give direct access to the report. In Method 1: Step 2, instead of Direct Access + click on the Advanced option as illustrated below.
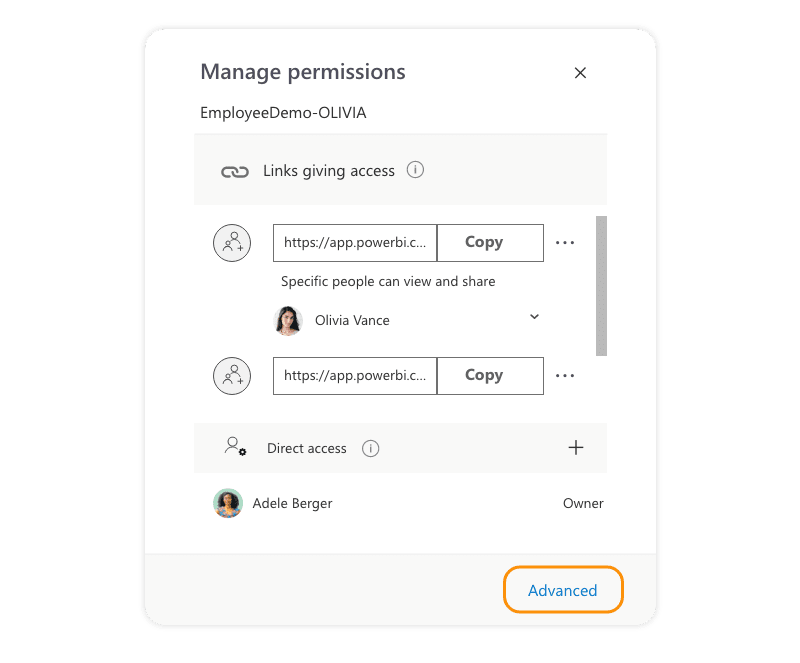
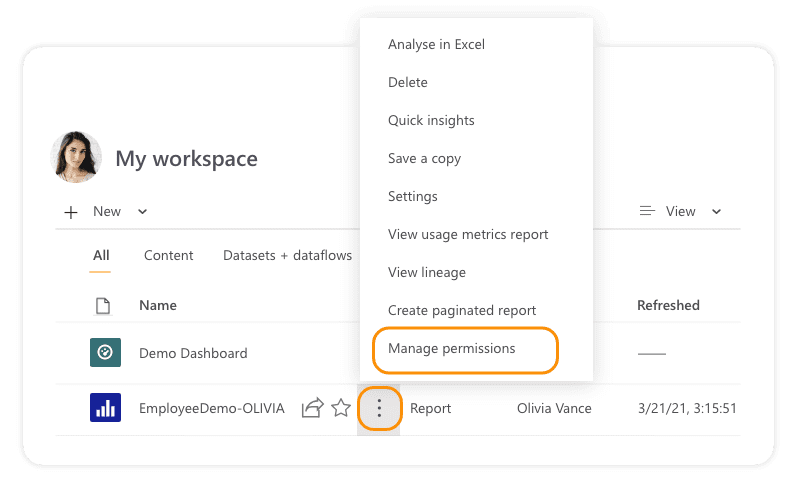
Alternatively, you can go to Manage permissions with advanced options directly from more options from your workspace, as shown below.
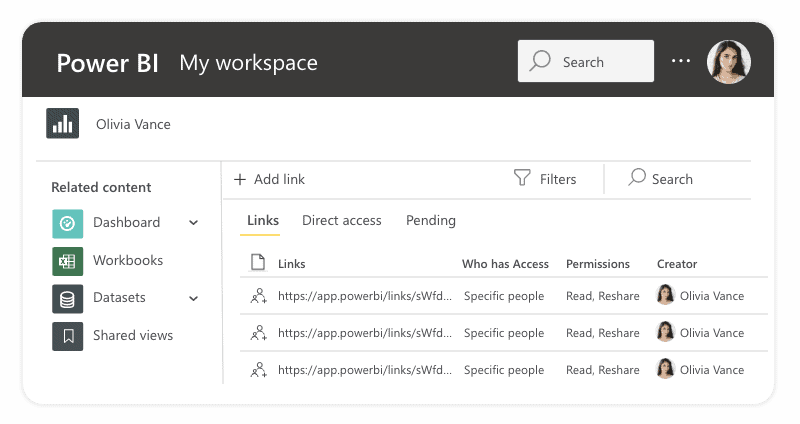
You can see Links, a Direct access user list, and a pending list on the manage permissions page with the advanced options. Additionally, you can see related content like Dashboards, Workbooks, Datasets, and Shared Views, as depicted in the picture below.
You can do the following things from the Manage Permissions page:
- View, manage, and create Links.
- View and manage who has Direct access and grant users direct access.
- You can also view all Pending access requests to the report, dashboard, and invitations.
- View and manage Related content.
- Additionally, you can apply Filters or Search for specific links or people.
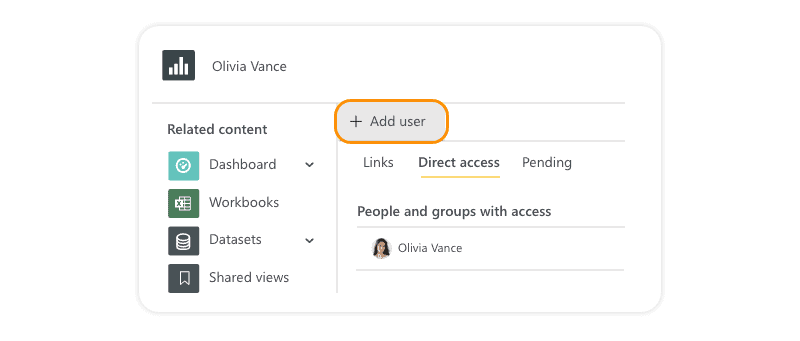
Direct Access
For Direct access, you can go to the Direct Access tab. You can see all the users who have direct access to this report and dashboard and give new users direct access. To give the new users direct access, click on add user as shown below. Then the user will get access to the report.
You will get the below dialog box. Provide the username or email address, then select or deselect the permission for the user and click on Grant Access. Additionally, you can write some additional messages/notes for users, which is optional.
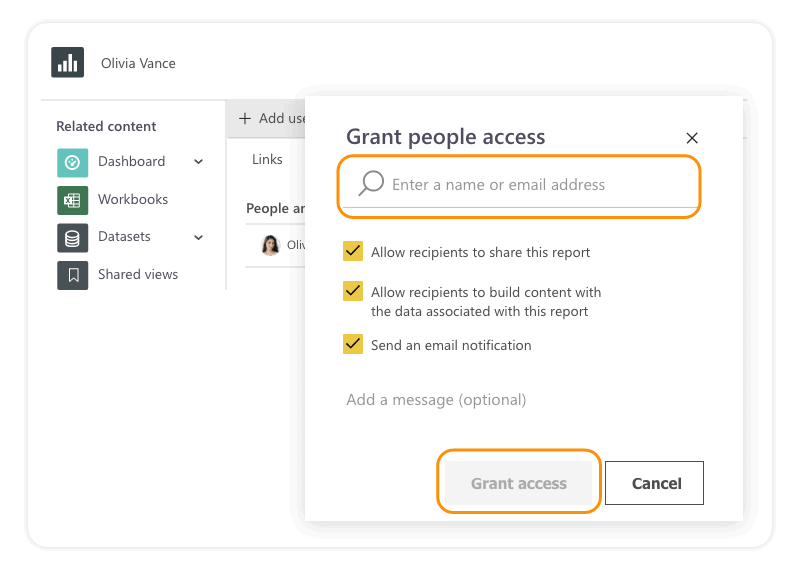
You will get the same sharing options as route 1. If you select the Send an email notification option, the user will get an email with a link to view the report.
Removing Direct Access and Sharing
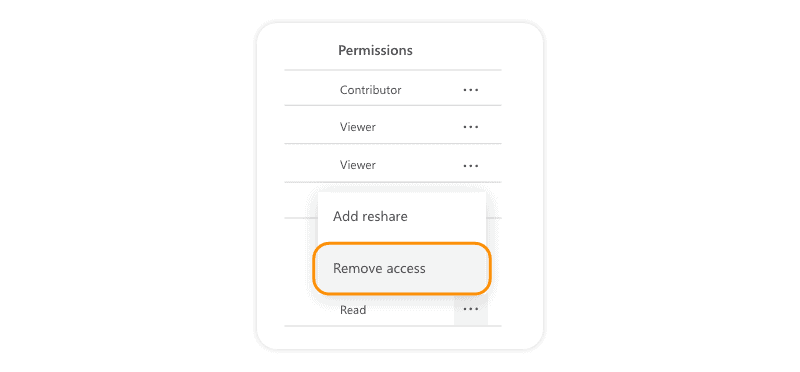
We can remove existing users’ direct access and sharing options from Power BI Service permission management. If you want to remove access to the user, you can click on the … more options and then click on remove access.
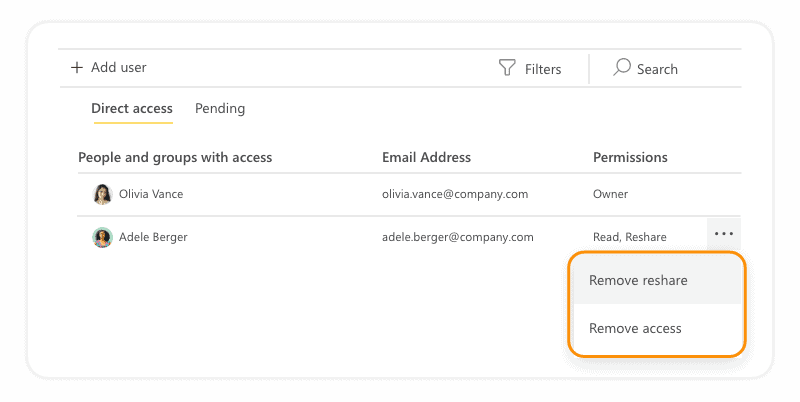
Go to more options of the user you want to remove and click on Remove access as illustrated.
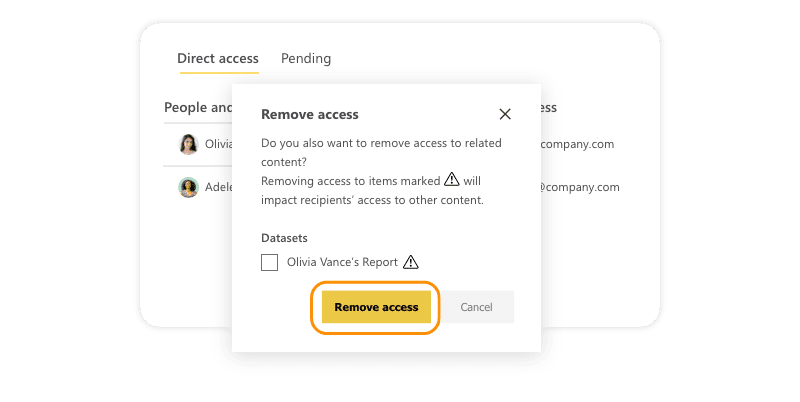
To remove access, click on Remove access and get the below window dialog, then click on Remove access as depicted.
Similarly, to remove the reshare option to the user, click on the … (more options) and click on Remove reshare.
What are the benefits of Power BI
We’ve written a blog post that goes into detail and elaborates 10 benefits of Power BI. But in short, Power BI is a handy tool for making sense of data. Its user-friendly design lets anyone create reports and dashboards, no tech wizardry needed. It connects with your existing apps like Excel and Dynamics 365, so you can gather all your data in one place for easy analysis.
The best part? It updates in real time. You can see live data visualizations, make quick decisions, and even access it from your mobile phone. Plus, it won’t burn a hole in your pocket. Power BI’s pricing scales with your needs, making advanced data analytics more accessible.
What are the cons of using Power BI
So, as you saw, Power BI is a very versatile and powerful tool for sharing data with users online and in a workspace.
However, there exist certain cons and disadvantages of using Power BI.
1. Table relationships
Power BI is good at handling simple relationships between tables in a data model. But, if there are complex relationships between tables, that is, if they have more than one link between tables, Power BI might not handle them well. You need to create a data model carefully by having more unique fields so that Power BI does not confuse the relationships when it comes to complex relationships.
2. Configuration of visuals
In most cases, you might not feel the need to configure and optimize visualizations in Power BI. But even if you do, Power BI does not provide many options to configure your visualizations per your requirements. Thus, users have limited options for what they can change in visuals.
3. Crowded user interface
The user interface of Power BI is often found crowded and bulky by the users. It is in the sense that many icons of options block the view of the dashboard or report. Most users wish the user interface or the report canvas were clearer, with fewer icons and options. Also, creating scrolling dashboards is a native feature.
4. Rigid formulas
As we know, the expression language used to deal with data in Power BI is DAX. However, you can perform a lot of actions using the DAX formula in Power BI, but it is still not the easiest language to work with. Sometimes the formulas you create work well in Power BI, but sometimes they don’t. You can concatenate up to two elements but concatenating more than two elements needs nesting statements.
5. Handling large data volumes
Power BI has a limit of ingesting data at a time, which is approximately 2 GBs of data. If you wish to import and use data of even greater volumes, you need to extend your free version to a paid version of Power BI. Also, users have reported that Power BI takes a little more than the usual time or even hangs while processing millions of rows and columns of data.
6. Complex to understand and master
Usually, Power BI is the easiest to use BI tool if you are using it to import data and create reports. But Power BI is an entire suite with many other interrelated tools. When the purpose of your use is more than just creating reports in Power BI Desktop, you need to learn and master several other tools like Gateways, Power BI Report Server, Power BI Services, etc.
How to overcome the cons of Power BI
We have now looked at some of the major features of Power BI in how it gives permissions and access to users, their roles, and the general workings of a workspace.
The analysis of the issues and challenges it presents shows just how critical it is to maintain control and security of your Power BI workspace.
Tools like Microsoft 365 Groups and Yammer can help you achieve that and maintain a secure M365 environment that allows you to fully optimize and leverage the benefits of a Power BI workspace.


