
Power BI Dashboards vs. Reports – which one should you use?
Table of contents
Somebody wise once said simplicity is the shortest path to a solution. If you’ve ever used Power BI, you’ll know exactly what they meant. With its straightforward user interface, Microsoft’s premier business analytics service allows just about anyone to navigate around easily. We’ve discussed it in quite some detail, from how workspaces function to what models are available for public use.
This blog post focuses on what Power BI is best known for: dashboards and reports. Both will simplify your life, provide clarity and improve your business decision-making. Still, there are some differences in how and when you should use them. To find out what they are, keep reading.
What is a Power BI dashboard?
Microsoft defines a Power BI dashboard as “a single page, often called a canvas, that tells a story through visualizations. Because it’s limited to one page, a well-designed dashboard contains only the story’s highlights, and readers can view related reports for the details.”
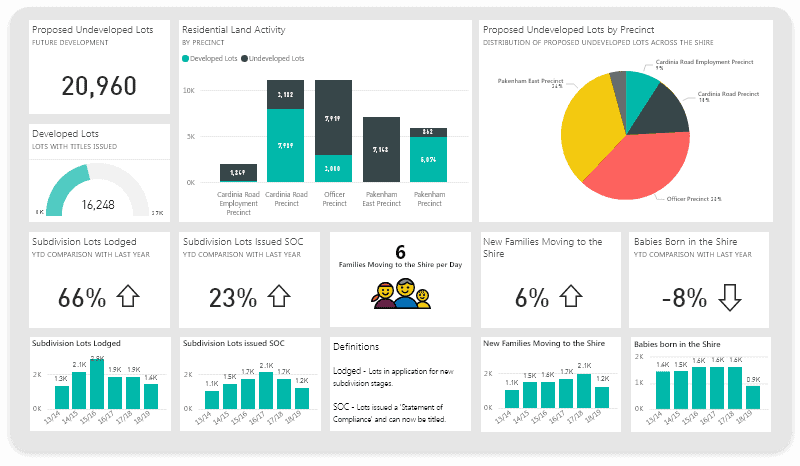
As it says, it provides the highlights or important information and data from stories or reports in a visual form. In plain language, it is a glimpse, and a sneak peek – the trailer you see before a movie—a sampling menu from a larger buffet.
With that out of the way, let’s look at some of Power BI dashboards’ most frequent uses.
Advantages of a Power BI dashboard
- Enables users to analyze reports and view all important metrics at a glance.
- Users can create visualizations from multiple datasets or multiple reports.
- Customization to meet the requirements of any enterprise.
- You can embed it into applications to provide a unified user experience.
- Can instantly share with other colleagues in an organization.
- Visualization of data helps in easily delivering information.
As we have seen, Power BI dashboards are a very powerful tool that can be used whenever a data summary is needed quickly and concisely. At the beginning of a report presentation, they provide a content summary to spark the interest of a user or an audience.
Ultimately, they round off data from multiple reports to provide the main conclusions and points of interest.
Thus, the uses of dashboards are limited only by the need and situation at hand.
What is a report?
To hear from Microsoft again: “A Power BI report is a multi-perspective view of a dataset, with visuals representing different findings and insights from that dataset. A report can have a single visual or pages full of visuals.”
While a dashboard may comprise visuals from several different reports, a report is a detailed breakdown of a single dataset.
A dashboard may present a teaser or one particular facet of a dataset, whereas a report provides the entire picture and, thus, a more robust view.
Advantages of a Power BI report
- Presentation of dataset information in an easily digestible way.
- Customization allows real-time updates of visuals as per changes in data.
- Easier to make sense of complicated datasets.
- Safe interaction with content as changing a report will not change the underlying dataset.
- Incorporation of visual aids and mediums to bolster dataset results.
As for the uses of a Power BI report, it is applicable and fit for use wherever a report needs to be presented in a visual or audio setting.
Since most reports and datasets are now digitally interacted with, a Power BI report can work to great effect even outside of those settings. Due to its ease of use, it allows for greater understanding and absorption of the major elements of a dataset.
Key differences between Power BI dashboards and reports
As we mentioned in the introduction, both Power BI dashboards and reports will simplify your life; they will help you make decisions and inform others with relevant data. But, there are differences between Power BI dashboards and Power BI reports. Here are the most important ones:
- The Power BI dashboard’s screen size page consists of vital information organized across different reports, datasets, and facts. In contrast, reports are a collected display of different datasets, and different pages are available to view report data.
- Power BI dashboards are not available for Power BI desktop as they are a feature of the Power BI service. However, you can create and view reports on the Power BI desktop.
- The Power BI dashboard uses different data sources, so each dashboard consists of maps, graphs, etc. But only one dataset can be used as a source for Power BI reports
- Power BI dashboard capabilities of pinning existing visualization are only from the current dashboard to other dashboards, normally called dashboard navigation. Still, Power BI reports can pin or navigate any reports or dashboards.
- Email subscription for the Power BI dashboard is not available. But, reports can be subscribed to by users to be delivered to their email box at any given point in time.
- Power BI dashboards have an alerting feature where if attention needed conditions arise, then the dashboards raise an alert but not in the reports.
- Power BI dashboards cannot slice and dice, but reports have many ways to filter and slice.
- Natural language queries are only available from the dashboard but not for reports.
- You can not change the Power BI dashboard visualization. Still, report visualization can be changed and saved, but it depends on the user’s role and permissions to access dashboards and reports.
- In the Power BI dashboard only, raw data can be exported. However, the presentation and visualization features are not. In reports, raw data can be exported to any format, like tabular formats.
- Reports are information providers to dashboards, which can be in many formats like text, Table, chart, number, etc.
- The dashboard is on page screen display, but we have multiple pages to navigate in a report as reports are detailed information.
- Power BI reports can be drilled down to different data levels to provide a more detailed picture
- You can export reports to any format and download them to a local desktop for further analysis.
- Reports can be published on the web and subscribed to through email.
- Dashboards have the same features as reports, but dashboards can be exported to limited formats. This is why they are used to visualize the important data rather than analyze it, which can only be done with reports.
Which is better? Power BI dashboards vs. reports
At this point, you must have realized that you cannot separate Power BI dashboards and reports. They’re the yin and yang of Microsoft’s business intelligence: they feed each other and work in synergistic harmony.
Both are powerful, versatile, and robust tools that can give a comprehensive wider picture or a comprehensive look at the minutiae and finer details
A good IT manager or business user can best leverage the tools at their disposal according to the needs and demands of the situation. Shunning one for the other would be a poor and ill-thought approach.
Protecting Power BI data
No matter how useful they are in daily work, Power BI’s visualization capabilities can compromise the security of your sensitive data if accessed by the wrong set of eyes.
With Syskit Point’s Power BI inventory and permission reports, IT admins get instant and accurate insights into facts, such as which data is exposed to whom, together with the intelligence of published reports and the corresponding time and data sources.
Book a no-obligation demo to discover how you can stay in full control of your Microsoft 365 environment with Syskit Point and ensure powerful insights into your Power BI ecosystem.


