SharePoint page performance—Why does it matter?
Table of contents
The SharePoint infrastructure can be quite overwhelming. It takes a lot of time and experience to understand how everything within it works. And even then, much of it remains a mystery. Precisely because of this uncertainty, we are quick to jump to conclusions when it comes to explaining why pages are loading slowly by blaming it all on SharePoint. But how can we be sure SharePoint is the culprit?
Another possible explanation could lie within the page itself. In general, a SharePoint page (or any page in general) consists of an assortment of content. Some of that content is visible—images, text, videos, or any other multimedia—and some of it comprises various JavaScript, CSS, and other file types. All that content has a “weight,” and the time it takes for a page to load is, in part, determined by that very “weight.” The relationship is simple: the heavier the page, the longer it takes to transfer the page to the end-user.
So, what steps are needed in order to fix any SharePoint page performance issues that may arise? First and foremost, there is a need to identify the exact cause (or causes, if you’re unlucky) of your slow page loading. As mentioned earlier, there may be a problem with the site itself (i.e., all the content within the page, and the internal processing that comes with it), or the issue may be network-related (in relation to the communication between the user and the servers that host the service), or there may be another reason (SharePoint) that’s outside of our control. This blog post aims to shed some light on how to successfully diagnose which of these is the exact cause of your poor loading SharePoint page performance.
SharePoint page load time diagnostics – Find and fix slow SharePoint page performance
When we open a SharePoint page, or any page in general, there is a lot of activity between our browsers and the servers responding to our requests. Beside the actual content, much metadata is provided in the request and response headers, such as various cookies and other useful information, like the page’s size and so on.
SharePoint (Online in Office 365 and On-prem) includes its own headers in the HTTP response, some of which provide great insight about the page processing and the network travel of our page request. And that’s the information we’re looking for, as described below.
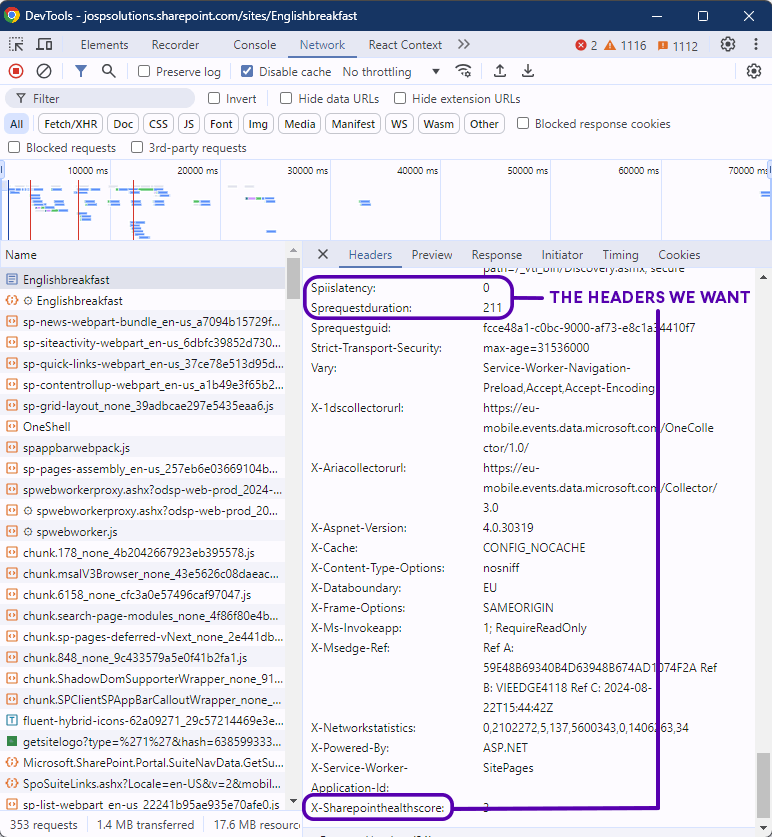
- SPIisLatency—the time in milliseconds taken by the front-end web server after the request has been received by that server, but before the web application begins to process the request. This value should be around 0 or 1, or very close to those figures.
- SPRequestDuration—the time in milliseconds that it took to process the request on the server. Fundamentally, this is the end-to-end processing time for the SharePoint page. Healthy pages have a value of around 200 ms, and a range of 100–500 ms, so if it’s greater than that, you may experience some issues. If this value is high, the next metric will be high as well.
- X-SharePointHealthScore—an indication of how heavily loaded the SharePoint farm was at the time the page was being served. The values range from 0 to 10. A score of zero is great, whereas a score of ten suggests a problem with your farm. Naturally, we hope this value is zero, but values up to four are also fine.
The values of these metrics, alongside the total time needed for the page to load, are all you need for good page profiling. X-SharePointHealthScore tells us how stressed the server was while serving the page. This can be expressed (approximately) by the following equation:
Total time = SPIisLatency + SPRequestDuration + Time spent “somewhere else”
or more illustratively:

The unknown time spent elsewhere can be extrapolated using simple math since we know the other values in the equation, thus:
Time spent “somewhere else” = Total time − SPIisLatency − SPRequestDuration
For example, if the following header metrics are provided:
- SPIisLatency: 10 ms
- SPRequestDuration: 790 ms
with a total time of 900 ms, we can determine the time spent elsewhere value: 100 ms.
So, how do we interpret these values alongside the X-SharePointHealthScore value? Well, since various pages can serve various content, where each individual part can affect the reported values, it’s necessary to determine whether the problem lies within the page itself or within the SharePoint environment.
Optimize SharePoint Page Load Time
The rule here is to define a baseline value for each metric based on a SharePoint page with close-to-no customization—for example, the OneDrive for Business landing page. Simply load up the page and retrieve the metrics, and we’ve got ourselves decent baseline values to compare our pages against. Later in the article, we will present various ways to get the header metrics we’re looking for.
Let’s assume we have the required metrics already. What conclusions can we draw when the difference between the retrieved and baseline values becomes too high?
High total time
The total end-to-end times can vary according to the content of your site. Usually, a value up to five seconds is fine. Higher values are usually an indicator to take a look at the other values have to say.
High SPIisLatency
Constantly high SPIisLatencies suggest that requests are backing up on the server, and thus that there may be some deeper server-side issues. However, high SPIisLatency for a brief period of time is usually nothing to worry about.
High time spent “elsewhere”
High time lost “elsewhere” suggests that the traffic between SharePoint and our computer has slowed down. Why that should be the case is not indicated, but it may be a consequence of many network conditions: excessive routing, firewall issues, or something else. The time spent “elsewhere” is usually compared against the SPRequestDuration. A value of 3,000 ms with a SPRequestDuration of 1,000 ms, for example, would signify that we perhaps need to look a little closer at time lost elsewhere.
High SPRequestDuration
A high SPRequestDuration value means that the page is taking a long time to process on the server. A value, for example, of 9,000 ms against a baseline value of 500 ms clearly indicates that there is a problem with the site and the “heavy” content it provides.
There’s a couple of ways to find the SharePoint Response Headers, so lets get to them.
Approach 1: Use the developer tools
As mentioned above, there is a lot of activity between our browser and the servers responding to our requests. To view this communication, all we have to do is to open the Network tab inside the developer tools of the browser of our choice. In this tutorial, I will be using Chrome, but it boils down to personal preference—Edge or Firefox are also fine.
1. Set up the developer tools
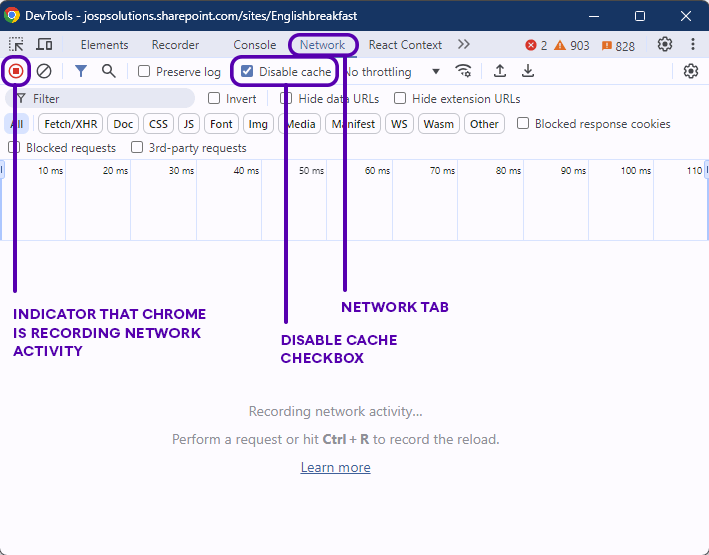
To start, open the SharePoint page you wish to inspect and open the developer tools by pressing the F12 key on your keyboard. You will be prompted with a window; click the Network tab visible at the top and you will see the network section of the developer tools:
Navigate to the Network tab, check the “Disable cache” checkbox in order to disable any client-side caching or selected features. Also, check whether network activity checking is enabled (the circle icon near the “Disable cache” checkbox should be red).
2. Capture the activity
By pressing F5, the site will be refreshed, and as the site is initializing you will see a lot of activity going on inside the developer tools. These rows are the individual exchanges our browser performs with the servers in order to load the entire content the site is providing. Each row is an individual response to a request our browser has made. The response can be anything: an image, JavaScript and CSS files, the page HTML, and so on. Keep track of the page loading progress inside the browser and make sure you stop the network capturing as soon the page content stops loading. That gives us an approximate page load time—the first troubleshooting metric we are after.
3. Find the headers
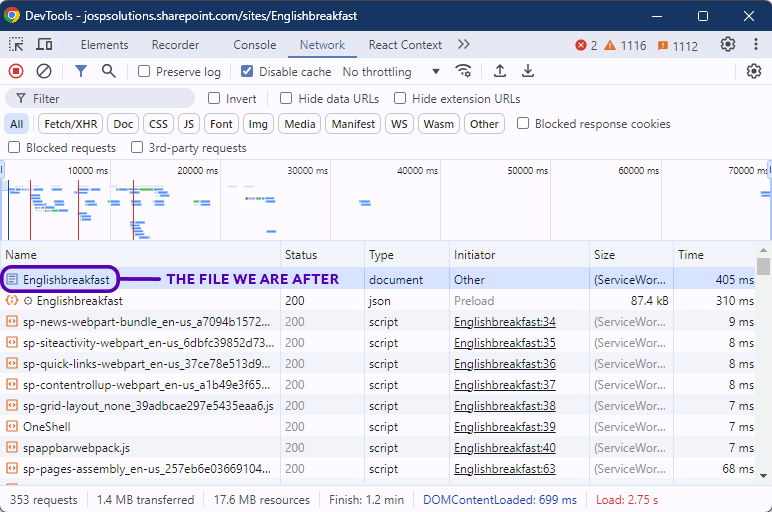
Even though there should be many requests made in order to render our page, the only request that we’re interested in is the one relating to the actual SharePoint page itself. That file is usually named like the SharePoint site. In my case, the file I was looking for was Englishbreakfast, and this was the first entry inside the requests list (which isn’t necessarily always the case), as shown in the image below:
Click on the file and you will see additional data regarding the response and request provided. Since the HTTP response headers are what we are looking for, click the “Headers” tab and expand the “Response Headers” group if they aren’t already exapnded. And here they are!
Approach 2: PowerShell
If you prefer a faster approach, we got you covered! With this PowerShell script you can get the metrics you’re looking quickly and easily. Just provide the page URL and the cookies if the page requires authentication, and you’re all set.
$Url = ”” # Enter the page URL here.
$rtFaValue = "" # Enter the rtFa Cookie here.
$FedAuthValue = "" # Enter the FedAuth Cookie here.
If ($rtFaValue -eq [string]::Empty -and $FedAuthValue -eq [string]::Empty) {
$response = Invoke-Webrequest $Url -UseDefaultCredentials -UseBasicParsing -Method Get
}
Else {
$session = New-Object Microsoft.PowerShell.Commands.WebRequestSession
If ($rtFaCookie -ne [string]::Empty) {
$rtfaCookie = New-Object System.Net.Cookie
$rtfaCookie.Name = "rtFa"
$rtfaCookie.Value = $rtFaValue
$rtfaCookie.Domain = "sharepoint.com"
$session.Cookies.Add($rtfaCookie)
}
If ($FedAuthCookie -ne [string]::Empty) {
$fedAuthCookie = New-Object System.Net.Cookie
$fedAuthCookie.Name = "FedAuth"
$fedAuthCookie.Value = $FedAuthValue
$fedAuthCookie.Domain = "sharepoint.com"
$session.Cookies.Add($fedAuthCookie);
}
$preloadCookie = New-Object System.Net.Cookie
$preloadCookie.Name = "service-worker-navigation-preload"
$preloadCookie.Value = [System.Web.HttpUtility]::UrlEncode('{"supportsFeatures":[1855,61313]}')
$preloadCookie.Domain = "sharepoint.com"
$session.Cookies.Add($preloadCookie);
$response = Invoke-Webrequest $Url -WebSession $session -UseBasicParsing -Method Get -Headers @{"accept"="application/json"; "User-Agent"="PostmanRuntime/7.41.1"}
}
$XSharePointHealthScore = $response.Headers["X-SharePointHealthScore"]
$SPRequestDuration = $response.Headers["SPRequestDuration"]
$SPIisLatency = $response.Headers["SPIisLatency"]
Write-Host "X-SharePointHealthScore: " $(If ($XSharePointHealthScore -ne $null) {$XSharePointHealthScore} Else {"Not Available"})
Write-Host "SPRequestDuration: " $(If ($SPRequestDuration -ne $null) {$SPRequestDuration} Else {"Not Available"})
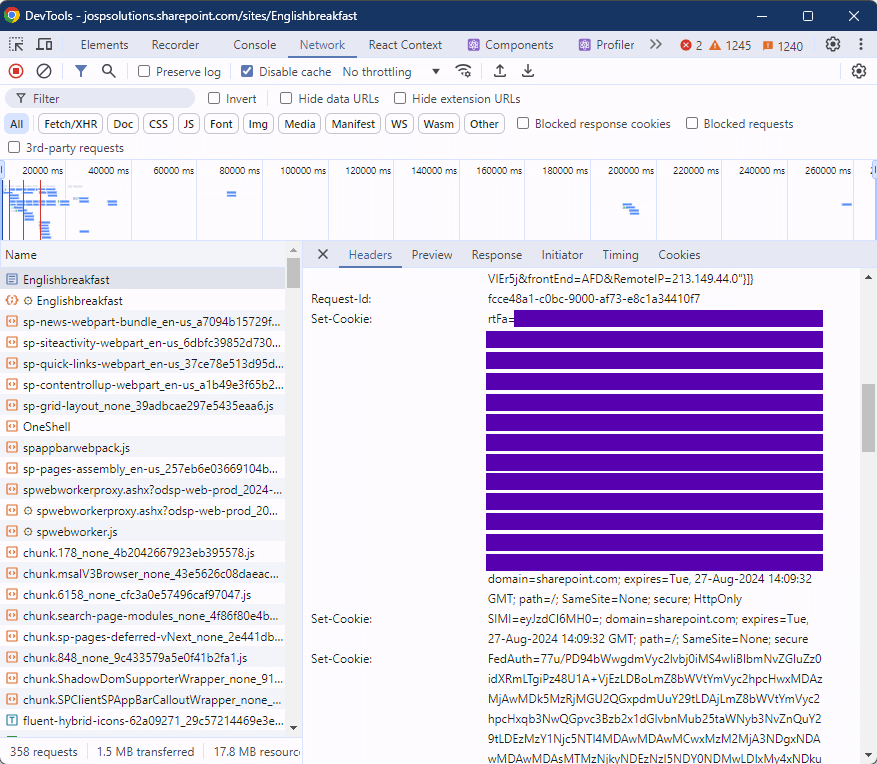
Write-Host "SPIisLatency: " $(If ($SPIisLatency -ne $null) {$SPIisLatency} Else {"Not Available"})The rtFa and FedAuth cookies can be found in the response headers of the .aspx file, in the same place we’re getting our metrics from. See the image below:
The texts marked orange (after the equals sign and before the semicolon) are with what we need to assign the $rtFaValue and $FedAuthValue variables. The cookies have an expiry period, so make sure you refresh them when necessary.
One should note that in many SharePoint pages out there, these metrics are not provided as the response headers; instead, they are hidden in the page source, which makes retrieving the relevant values more complicated.
Gif walkthrough of the process
Here’s a step by step walkthrough of the entire process:
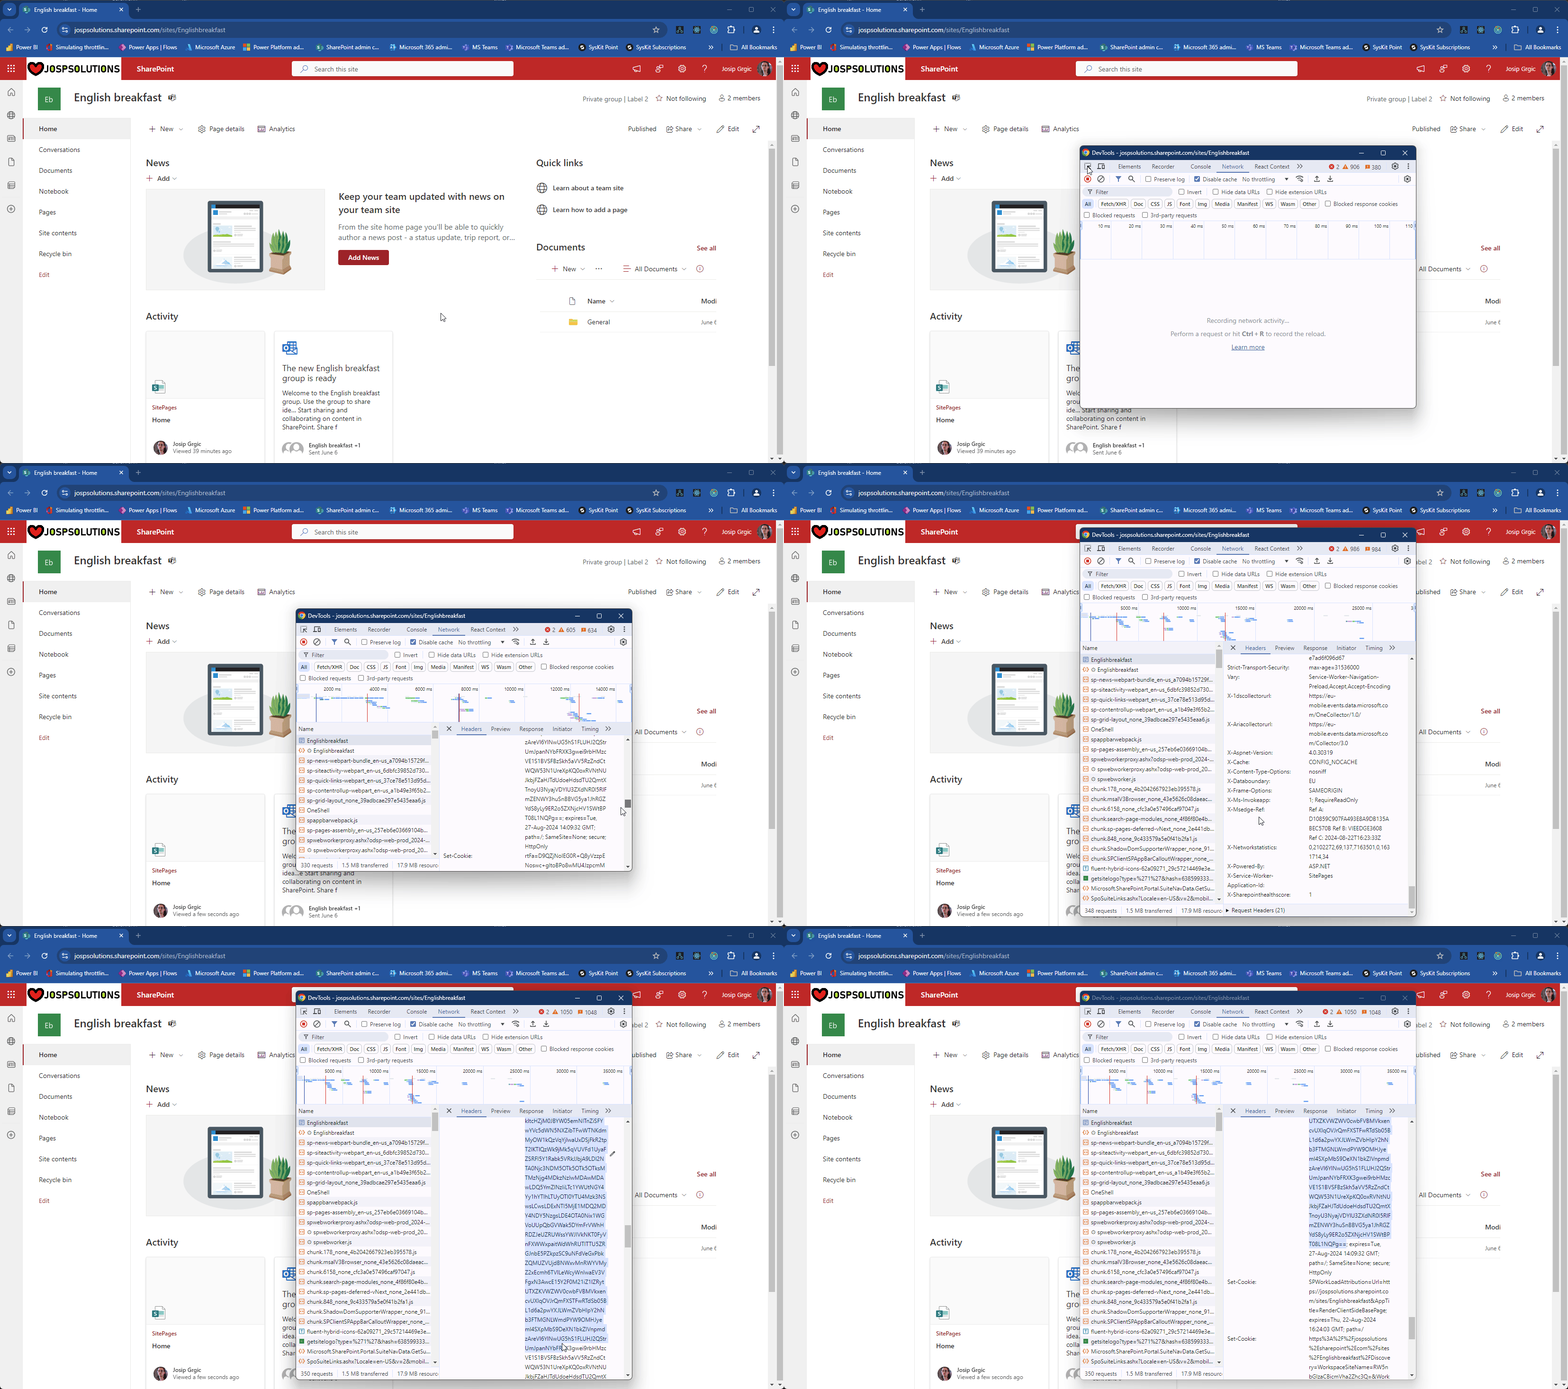
Approach 3: Use the Page Diagnostics for SharePoint tool
There’s a lot of information out there on how to fine tune SharePoint performance. Microsoft has great documentation that can help you improve the performance of your page’s load time, such as the following article.
If you explore the article a little bit you will run into a tool called Page Diagnostics for SharePoint. It’s a tool most people aren’t even aware of, and is worth checking out.
Approach 4: Syskit Insights for optimized SharePoint page performance
It’s important to make multiple measurements over a period of time since a single measurement can hardly represent the shape of the entire system. Sudden spikes in certain values sometimes occur, but that doesn’t have to mean anything serious is happening with our environment. And then there’s the problem of missing metrics in some pages. How great would it be if there was a way to continuously collect all the SharePoint page performance metrics—and not just from one, but multiple, pages at the same time? Wouldn’t it also be cool to be able to automatically compare the measurements against defined baseline thresholds and receive a real-time alert when the values become critical? Well, all your wishes have just come true. Syskit Insights now has all of these features, and so much more besides.
Simply navigate to the SharePoint page Performance section, enter the pages you wish to monitor, define the baseline values as mentioned above, and let Syskit Insights do the rest.
What we monitor:
- SharePoint header metrics:
- SPIisLatency
- SPRequestDuration
- X-SharePointHealthScore;
- Page Response Time;
- Total JavaScript and CSS file sizes and their load time;
- Page Uptime.
How does it all look?
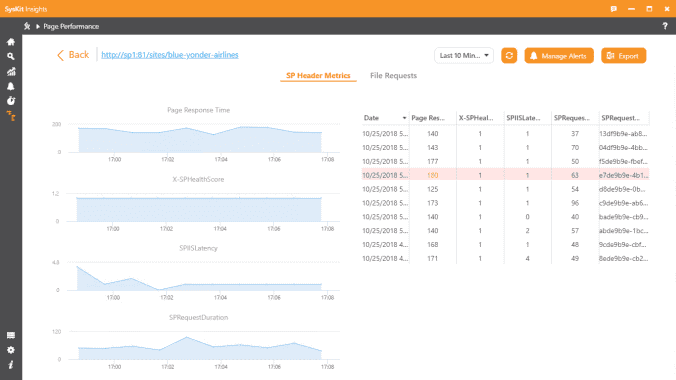
Get a simple overview of all response header metrics. Keep a close watch over Page Uptime, X-SharePointHealthScore, SPRequestDuration, SPIisLatency, and Page Response Time. If your SharePoint page becomes slow or sluggish, you will receive an alert, so you’ll know about it before your users do.
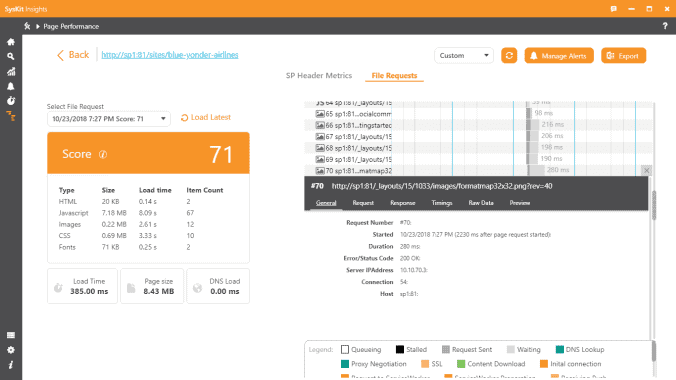
The File Request Waterfall vividly encapsulates every single element of a page and shows how long it took for CSS and JS, or HTML, to load. In addition, you can drill down and see the details, such as timings and the preview of an image. The File Request Waterfall, makes it easy for you to find the problematic elements of a page—like, for example, a large image that’s slowing down the SharePoint page load time—and do something about it.
Inspired by The Five-Minute Page Performance Troubleshooting Guide for SharePoint Online, by Sean McDonough
