Custom server monitoring templates for specific server roles
Table of contents
The newest Syskit version, the 2016 R2 – 8.0, is equipped with customizable server monitoring templates. And that’s awesome, because it means that Syskit allows you to create consistent monitoring templates that can be applied across the whole server environment.

This, of course, applies to all technologies that Syskit supports.
In a single console, you have a few predefined Syskit server monitoring templates that can be used for the most common server roles (SQL, IIS, SharePoint). However, to be most successful in monitoring server performance metrics and configuration, create your own templates.
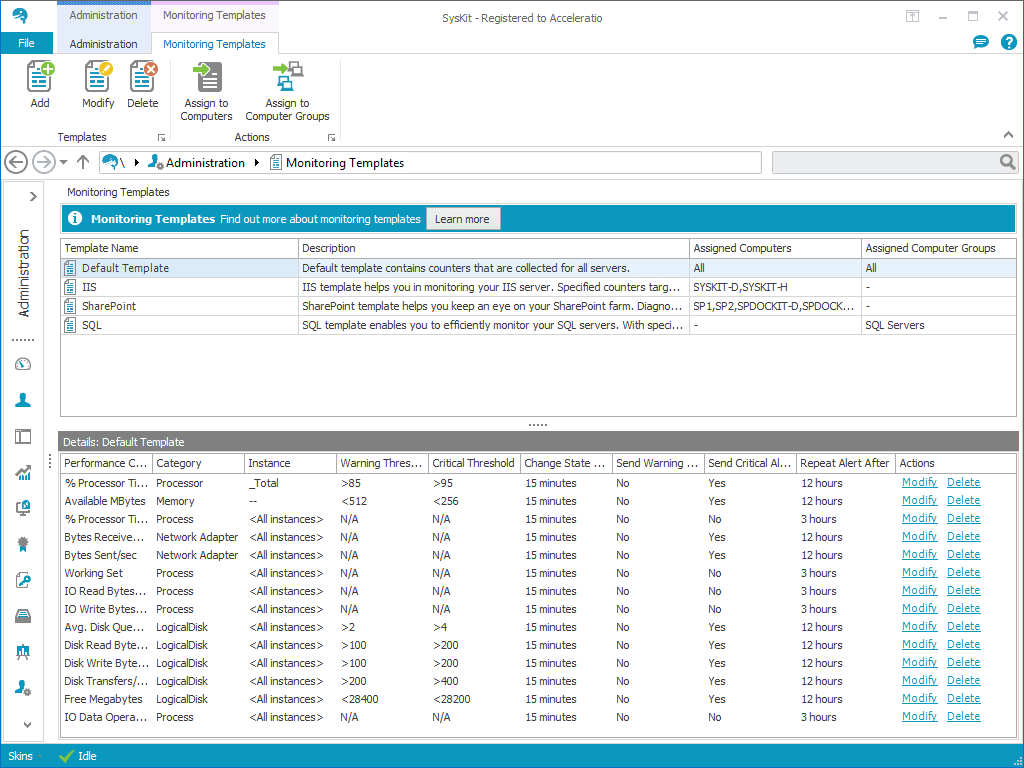
The predefined server monitoring templates that are currently include the:
- Default template containing various counters that have been collected for all users,
- IIS template for monitoring IIS servers,
- SharePoint template for monitoring SharePoint farm performance, and
- SQL template for monitoring SQL Servers and preventing bottlenecks and performance issues.
For instance, the SQL Server performance depends on the SQL Server transaction and queue values, and it is important to monitor them so the values don’t reach a critical level. In case you do indeed detect high values for these counters, you may want to inspect what’s going on with the databases and queries.
Note that every Monitoring Template must contain least one monitoring element, and there are two that are currently available—Performance Counters and Windows Services.
Create and customize server monitoring templates
However, to properly manage monitoring server performance metrics and configuration, create your own template. Creating your own template allows you to customize counters to best fit the needs of your server environment and to fine tune important thresholds.
Having your own server monitoring templates will be even more valuable to you if you already know which custom performance counters and thresholds you should track for specific server roles, such as Citrix.
For example, if you have a Citrix XenApp server, with Syskit you can create a Citrix custom template by defining thresholds and counters that are specific to Citrix, such as Citrix CPU Utilization Management User, Citrix IMA Networking, ICA Session, or Citrix Licensing usage.
Add, modify, or delete custom templates
This makes the whole idea of server performance monitoring a lot easier and more comprehensible. You leave out the unnecessary metrics that don’t apply to your specific environment, and Syskit actually provides you with all the relevant data.
And here’s the best part—you get to choose exactly which metrics are important and necessary to be included in the template.
Now, when you have an environment with different server roles that all require different performance counters, you can create multiple server monitoring templates and assign them to each server or to logical server groups.
A unique set of Windows registry counters contains detailed statistical information for components such as processor, memory, processes, hard disk, and cache.
When enhancing your monitoring templates, the Syskit Template Wizard will guide you through the custom server monitoring configuration.
The Template Wizard allows you to:
- define warning and critical thresholds so that you receive alerts when a warning or critical state is reached,
- define threshold change intervals
- set up a notification system via email so that you receive alerts when threshold values go overboard,
- add services according to your environment needs and receive a notification if any services stop working (Syskit can auto-start the application in question), and
- configure services to define actions, such as restarting a critical service after it has stopped for some reason.
For more detailed input on how to set up custom performance counters, refer to our Monitoring Templates help article.
The Syskit team is planning to improve this feature and add even more default templates in the next few releases. Perhaps you have some ideas about which counters we can add or which metrics you would like to monitor—we’d love to hear from you in the comments below!