Often they need to answer simple questions, such as:
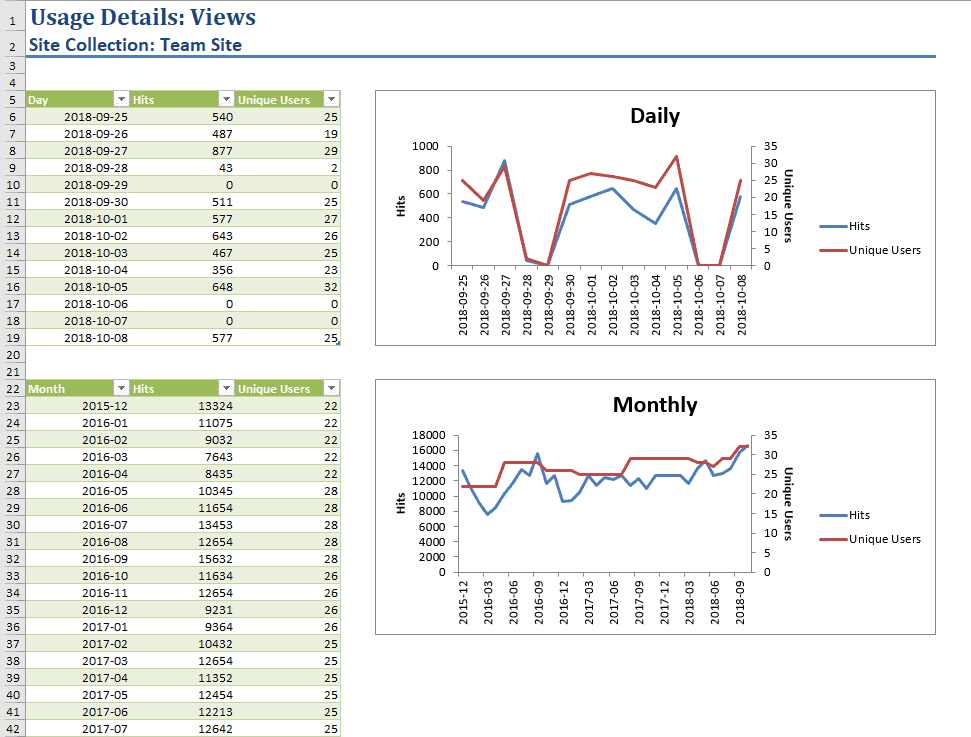
Out of the box, SharePoint does provide some help with these questions. SharePoint 2010 had a dedicated Web Analytics service application that provided some insights into the behavior of users on your SharePoint sites. It did a pretty decent job, but primarily for performance reasons, it was discontinued in SharePoint 2013. SharePoint 2013 added a new SharePoint Analytics Processing Component, which is now a part of the Search service. It provides you with some basic reports:
You can find detailed instructions on how to use this report here.
The main problem with these reports is that they will not give you a big picture of what is happening on your farm. You need to generate an Excel report site collection by site collection, and even when you try to narrow your report down to a single site collection, you still must go site by site, and list by list, to see what is happening. That requires too much work and is too time-consuming to be useful. Another pitfall is that there is no API to automate this work.
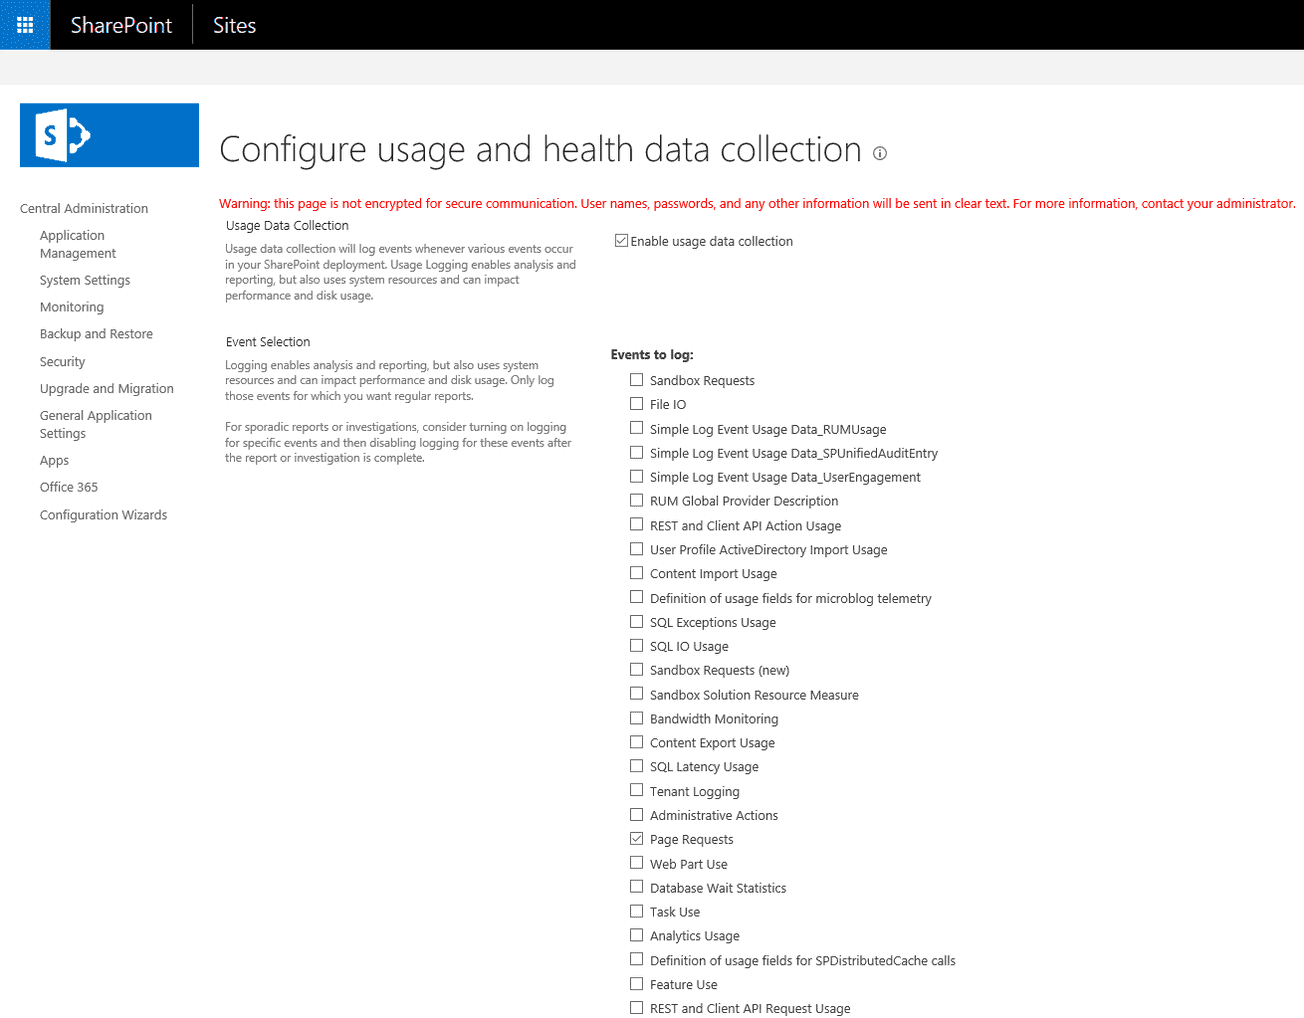
With so many limitations to the out of the box options, you might need to resort to other options in your search for answers to the questions that started all of this. One option is to use the Page Request events collected by the Usage and Health Data Collection Service, which is easy to configure: You just need to navigate to Central Administration > Monitoring > Configure usage and health data collection in SharePoint Server and ensure that “Enable usage data collection” and “Page requests” are checked. Once configured, SharePoint will immediately start to collect usage logs.
First, the usage logs are saved to the disk on each WFE server in your farm in the default location C:Program FilesCommon FilesMicrosoft SharedWeb Server Extensions16LOGS. There is a timer job, “Microsoft SharePoint Foundation Usage Data Import,” which will move them to the Logging Database Server every five minutes. Depending on the number of active users and events you wish to log, this database can grow very fast, so it is important to check the data retention settings for events that have a default value of 14 days. You can check these with the following PowerShell cmdlet Get-SPUsageDefinition and change them with Set-SPUsageDefinition.
Now that you have set everything up, you can generate reports by querying the logging database. Page Request events are stored in a total of 31 partitioned tables ranging from RequestUsage_Partition0 to RequestUsage_Partition31. To avoid having to UNION across all partitions it is best not to use the tables directly but to use the RequestUsage view instead.
Once you examine the RequestUsage view, you will notice the most important columns: LogTime, UserLogin, WebApplicationId, SiteId, SiteUrl, and WebId. So, knowing all this, let’s try to determine how many active users were on my farm last week. Here is the sample query:
From the query, you will notice that we are trying to filter out things that are not a real user interaction with a page on your farm. To further improve the reliability of this query, it would be a good idea to filter out a few more things:
Knowing all this, let’s try to solve another problem by finding the most active site collections last week:
You can see that it is simple to modify the query to get information about site collections. You could easily go down to the subsite level by adding a GROUP BY on the WebId column.
Although this approach gives you some answers, you need to be aware of its limitations:
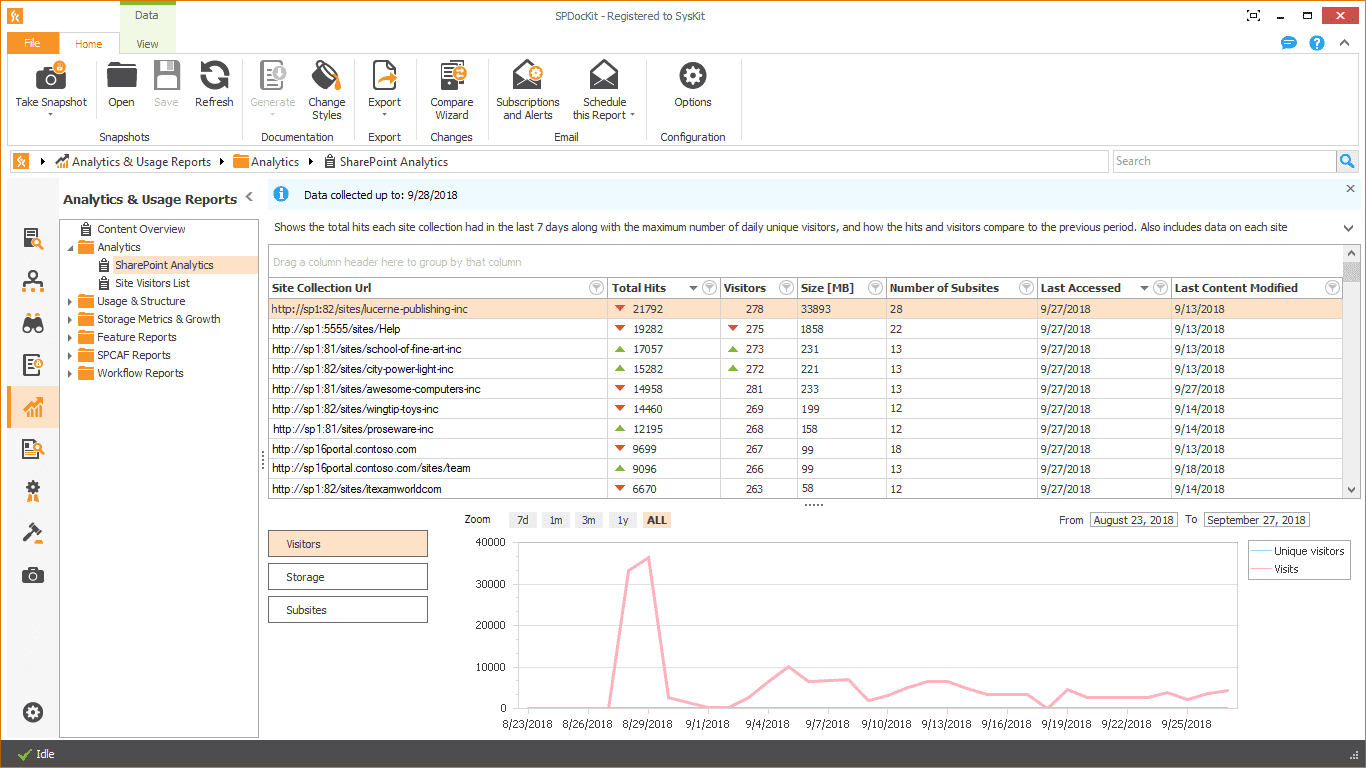
SPDockit’s Analytics and Audit reports can help you get answers to your questions without losing a lot of sleep. They are easy to configure and overcome most of the limitations mentioned before.
You can get a clear picture of how your users are interacting with the farm on the SharePoint Analytics report introduced in version 8. It includes information and summaries about the number of page hits, unique visitors, storage usage, and the number of subsites for each site collection, as well as detailed trends showing how these metrics changed in the past and how they are behaving now. For those who are looking for some additional insight into how the site collections are performing, you can quickly narrow down to the subsite level and get a report that answers questions about site activity.
With SPDockit, there is no need to stop at the subsite level with the number of views and visitors shown by the Analytics reports. You can use our new Audit reports to get information about who is visiting SharePoint sites and opening files. Some of the events you can track here are:
New SPDockit is now available, so download 30-day free trial and try it yourself.